Room to Run
11.15.19
After a sleepy start to the week, the S&P 500 sprang to life late on Friday. Larry Kudlow, Director of the National Economic Council, gave notice that a trade deal between the U.S. and China could be close at hand. The market applauded this sentiment by sending stocks to new highs for a third straight Friday. After the move, we sit roughly 8% above the early October low. Naturally, questions about the durability of this rally are increasing by the day. Yet, a look at the market’s valuation and technicals show we could have some room to run.
Much of the move over the last month and a half has been about clearing the slate. The Fed has graced the market with more accommodative policy, the administration appears to be progressing on a China deal, and corporate earnings surprised to the upside in the 3rd quarter. As we said last week, there is still a risk that a trade deal fails to materialize and that politics keep businesses nervous well into next year. However, with at least some of the wall of worry coming down, the market could potentially turn its attention towards the fundamental improvement projected for 2020. While this year’s sales and earnings have held up better than expected, they have faced tough comparisons vs. a tax cut fueled 2018. As we turn the calendar, both sales and earnings are projected to reaccelerate. Revenues are set to grow at 5% up from 4.5% this year and earnings are set to grow at 10% up from 1.6% this year. This fundamental growth could certainly justify higher asset prices in the coming year.
On that front, a fresh look at our valuation model (graph below*) shows that based on consensus earnings estimates the S&P 500 is trading approximately 6% below the model’s projected price 12 months from now. At a 75% confidence level, we project a range between -8% and 20%. This means that given the historical fluctuation in earnings, a price range between $2,872 and $3,758 would be reasonable. This is a -8% downside and a 20% upside from today’s index level of $3,120. Valuation is not stretched in our eyes.
Beyond the fundamentals, the technical picture is largely favorable as well. Leadership has turned decidedly cyclical, breadth has expanded, sentiment is not yet overly bullish, and we are moving into a strong stretch of the calendar. November and December have historically been strong months in the market. This is certainly not always the case but is something to keep in mind. If there is any knock against this rally, it’s that small caps have really failed to gain much traction. We’d like to see participation broaden out to this traditionally risk-on group. We’ll be watching closely.
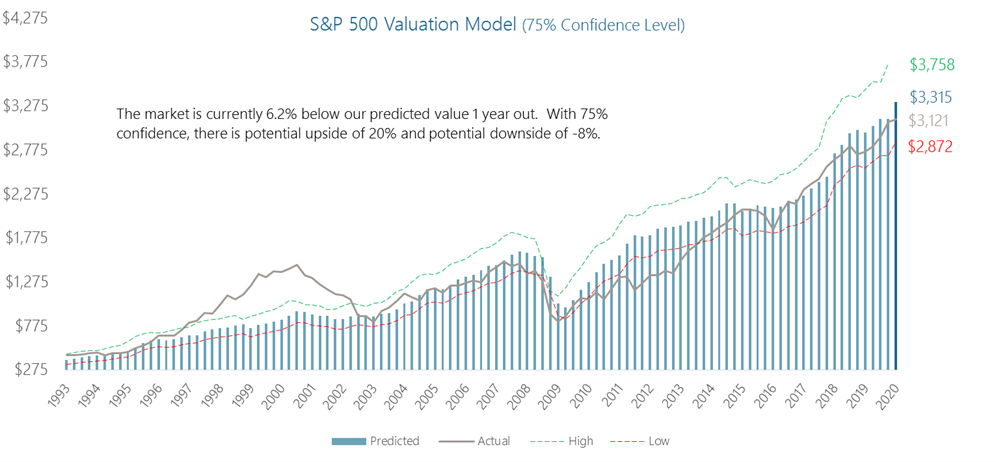
*DCM uses this proprietary valuation model to evaluate whether companies are priced higher or lower than their intrinsic values. The intrinsic value is calculated using regression analysis measuring the relationship between price and fundamental variables., and is based on a series of assumptions based on the historical performance of the market. No graph, chart, formula or other device offered can in and of itself be used to make trading decisions. Past performance is not a guarantee of future results.
This report was prepared by Donaldson Capital Management, LLC, a federally registered investment adviser under the Investment Advisers Act of 1940. Registration as an investment adviser does not imply a certain level of skill or training. The oral and written communications of an adviser provide you with information about which you determine to hire or retain an adviser. Information in these materials are from sources Donaldson Capital Management, LLC deems reliable, however we do not attest to their accuracy.
An index is a portfolio of specific securities, the performance of which is often used as a benchmark in judging the relative performance to certain asset classes. Indexes are unmanaged portfolios and investors cannot invest directly in an index. An index does not charge management fees or brokerage expenses, and no such fees or expenses were deducted from the performance shown. Past performance is not a guarantee of future results. The mention of specific securities and sectors illustrates the application of our investment approach only and is not to be considered a recommendation by Donaldson Capital Management, LLC.
S&P 500: Standard & Poor’s (S&P) 500 Index. The S&P 500 Index is an unmanaged, capitalization-weighted index designed to measure the performance of the broad U.S. economy through changes in the aggregate market value of 500 stocks representing all major industries.